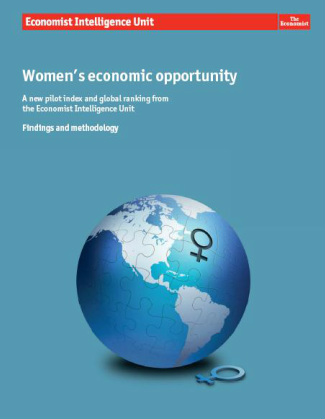
 Tags: economic sociology, education, gender, inequality, methodology/statistics, violence, data visualization, stratification, 06 to 10 mins Year: 2011 Length: 6:36 Access: YouTube Summary: This clip utilizes data visualization techniques to present data from the Women's Economic Opportunity Index, a measure constructed (and 150-page report published) by the Economist Intelligence Unit, an in-house research unit for The Economist. Detailed storyboards present data on women's economic status from 113 countries across the globe, including information on education, equal pay for equal work, the relationship between gender violence and earnings, paid maternity leave, and the discrepancies between legislation and enforcement around laws aimed at promoting women's economic opportunities. Viewers might be especially surprised to learn that, of the 113 countries analyzed, the United States lags behind is Western counterparts on many measures, and is currently the only country out of the 113 that does not offer some kind of mandatory paid maternity leave for women. While this concise 6-minute clip would be great to show in a class on gender and global economics, inequality, education, and/or violence against women, the density and pace of the information presented also makes this clip ideal to incorporate in a take-home assignment, where students can have time to re-watch the presentation and process the information. For another clip on The Sociological Cinema that uses data visualization techniques, click here. Submitted By: Lindsey Baker
2 Comments
Manuel Franco
7/30/2023 12:40:28 pm
I just want to say Thank You to everyone who supported me through the years. My name is Manuel Franco, New Berlin, Wisconsin. My story of how I won the Powerball lottery of $768.4M is a bit of a tale. I have been playing Powerball tickets for 6 years now since I turned 18. I bought my first ticket on my 18 birthday. I was feeling very lucky that day because I had contacted Dr. Odunga Michael to help me with the winning Powerball numbers. I really had that great great feeling that I looked at the camera wanting to wink at it. I only did a tiny part of it and trusted him. He gave me the numbers after I played a couple other tickets along with it for $10. I checked my ticket after the winnings came online and saw the numbers were correct including the Power play. I screamed for about 10 minutes because it felt like a dream. I had won $768.4M. You can check my winning testimony with the lottery officials just with my name search. Thank you Dr Odunga. Well, his email is [email protected] and you can also call or Whats-app him at +2348167159012 so you guys can contact him
Reply
mark hold
7/8/2024 09:11:30 am
Herbal Penis Enlargement product is 100% guaranteed to Enlarge and get a better ERECTION, the reason why most people are finding it difficult to enlarge Penis is that they believe in medical reports, drugs and medical treatment which is not helpful for Penis Enlargement. Natural roots/herbs are the best remedies which can easily Enlarge your Penis permanently Contact Dr MOSES BUBA via Email: [email protected] or via WhatsApp: +2349060529305. for Natural root and herbal remedies put together to help Enlarge manhood and Erect healthily. I also learn that Dr MOSES BUBA also can cure other types of diseases, HEPATITIS B,DIABETICS,CANCER,HPV,LOW SPERM CAM, HIV/STDS, FIBROSIS LOST OF WEIGHT, BREAST ENLARGEMENT, HIPS and BUMS ENLARGEMENT etc .
Reply
Leave a Reply. |
Tags
All
.
Got any videos?
Are you finding useful videos for your classes? Do you have good videos you use in your own classes? Please consider submitting your videos here and helping us build our database!
|
 RSS Feed
