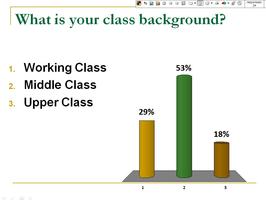
 How do we get students to understand where their own social views come from? How are their views shaped by social structure? In my Social Problems class, I use debate-style readings and clickers to encourage students' understanding of their own views through a sociological lens. This can be done across many topics but one particularly successful topic I have utilized this in is a module on class inequality. First, students read about class and class inequality. They learn how to define class, what their own class location is, the trends regarding class inequality, and theories that seek to explain class inequality. Toward the end of the module on class inequality, I have students read opposing views on the question "Is increasing economic inequality a serious problem?" (found in Taking Sides: Clashing Views on Social Issues). We discuss the opposing arguments, then, through a series of clicker questions, we move beyond the arguments to examine how our own social location shapes how we evaluate the arguments, and ultimately our own views on social issues. I do this using clickers in the following manner: 1. At the beginning of class, I ask students "What is your social class?" Using clickers, students respond anonymously. The technology then automatically tabulates the responses and gives an instantaneous graph like the one to the right. 2. As a class, we outline the arguments for and against whether or not rising economic inequality is a serious social problem. Students use the readings to identify each side of the debate, and we have a discussion about the merits of each argument. 3. Using clickers, I then ask students "Do you think increasing economic inequality is a serious social problem?" Again, the clickers allow students to respond anonymously. (Note: students absolutely LOVE seeing their peers' opinions on issues we discuss in class!) Our instantaneous results show something like this: 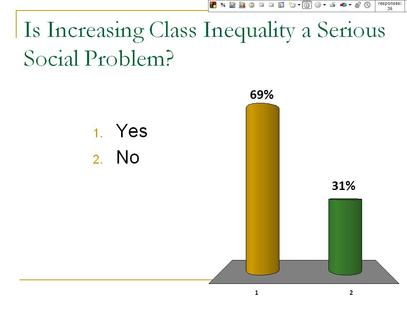 4. Next, I link the first clicker question (on class background) to the second clicker question (on opinions about economic inequality). The clicker software (Turning Point) makes this very easy. It then automatically links each individual's class background to their view on class inequality and gives us a graph like this: 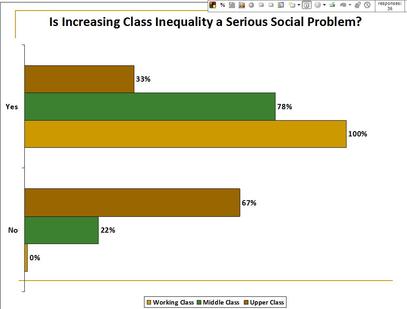 5. As the graph above demonstrates, all working class students believed increasingly economic inequality was a serious social problem. Most (but not all) middle class students thought it was a problem, and fewer upper-class students felt it was a problem. Unfortunately, the legend at the bottom makes this a little hard to see at first, but we'll forgive the software makers on this version. Finally, I then ask the class if there is a pattern about views on class inequality. Once they have identified the pattern, I ask them to try to explain why this pattern exists. Linking this pattern to course readings (e.g. Stuber 2006, "Talk of Class: The Discursive Repertoires of White Working- and Upper-Middle-Class College Students), I encourage students to think about how our social location shapes our everyday experiences, and therefore, our class awareness, class consciousness, and opinions about class inequality.
This activity can be used to explore all kinds of views and spark interesting class discussions. How does our race shape our views on affirmative action? How does our gender shape our views on feminism and gender equality? I really like it because it forces students to take a position (albeit anonymously), while allowing the class to examine their own views without anyone feeling called out. The data is personalized (as opposed to ONLY seeing national data) but an individual student's views which may not be popular are simultaneously de-personalized. While their anonymity allows them to voice their opinion, it also allows us to critically engage them without people pointing fingers at each other. When I have tried this particular activity in class, it has usually produced results that we sociologists would predict. But the danger, of course, is that students' opinions will not match up to the expected relationship. Afterall, our sociology classes are hardly a random, representative sample. For this reason, I always have a related slide that shows national, representative data that does depict the relationship and still allows us to engage the pertinent questions. If there is a mismatch, we can even ask them why this might be and have a discussion about sampling and methodology. I am curious if any of you have tried similar activities and how you used them in class? Paul Dean
0 Comments
Leave a Reply. |
.
.
Tags
All
|
 RSS Feed